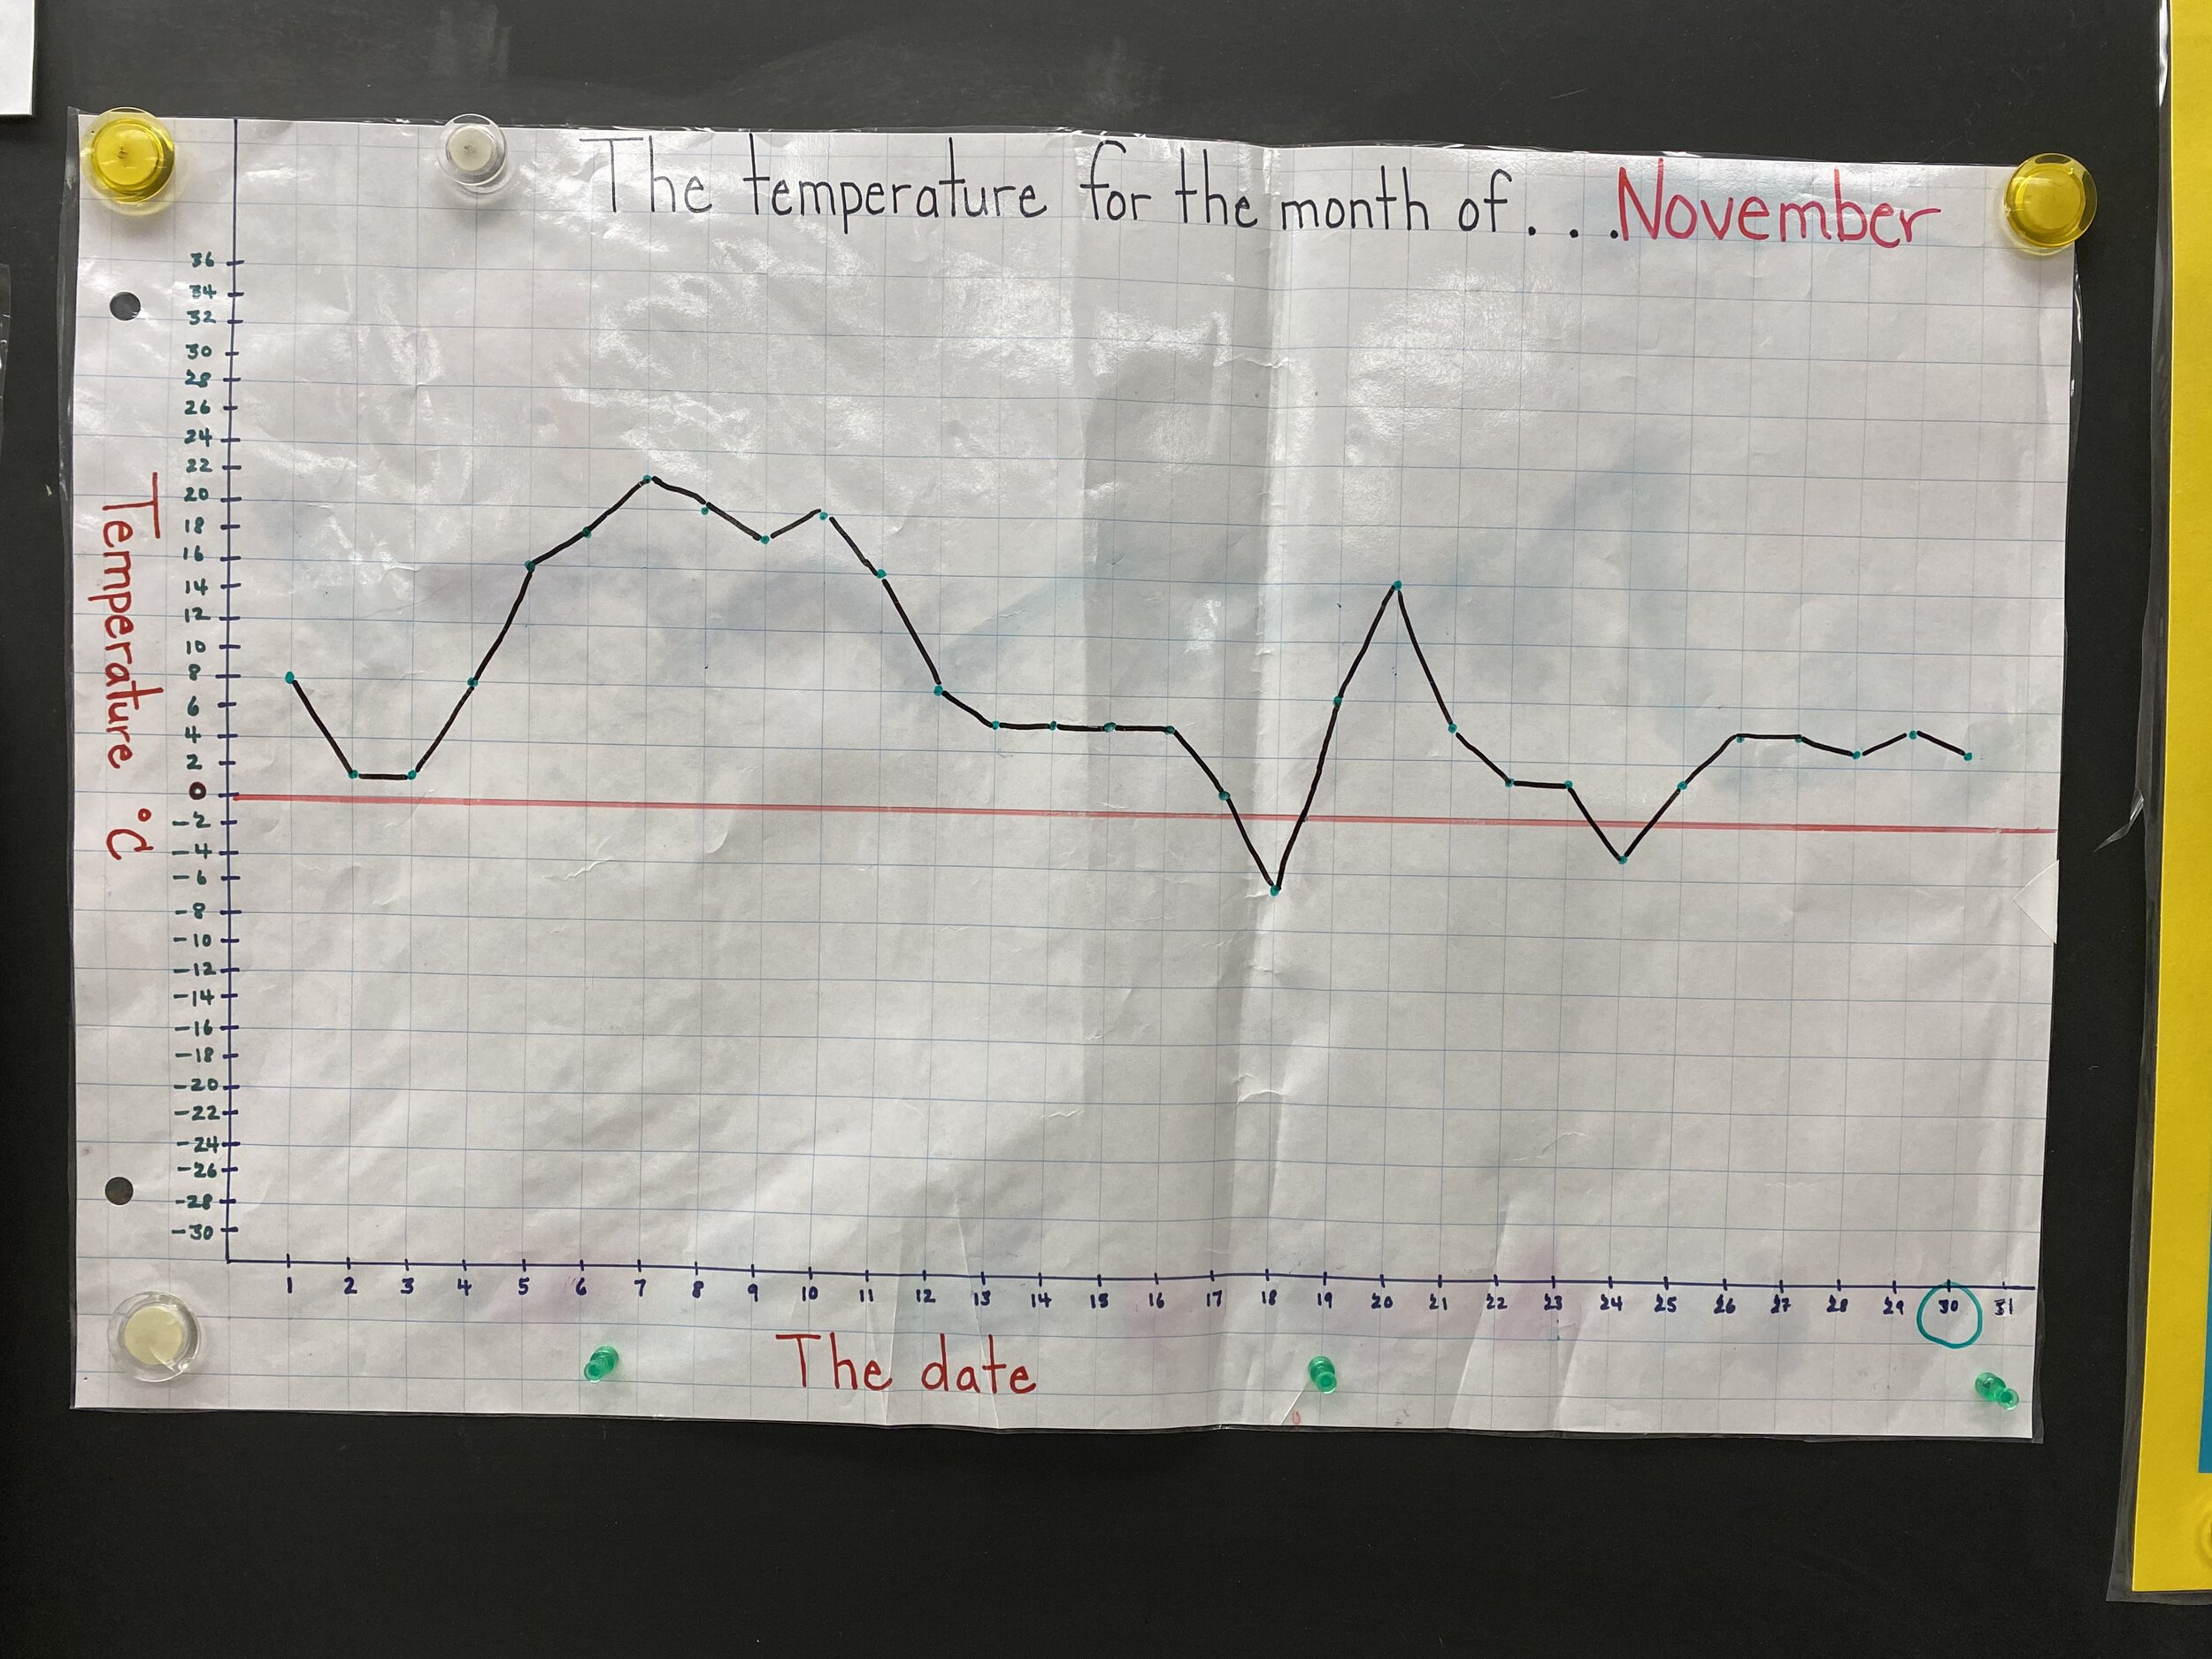
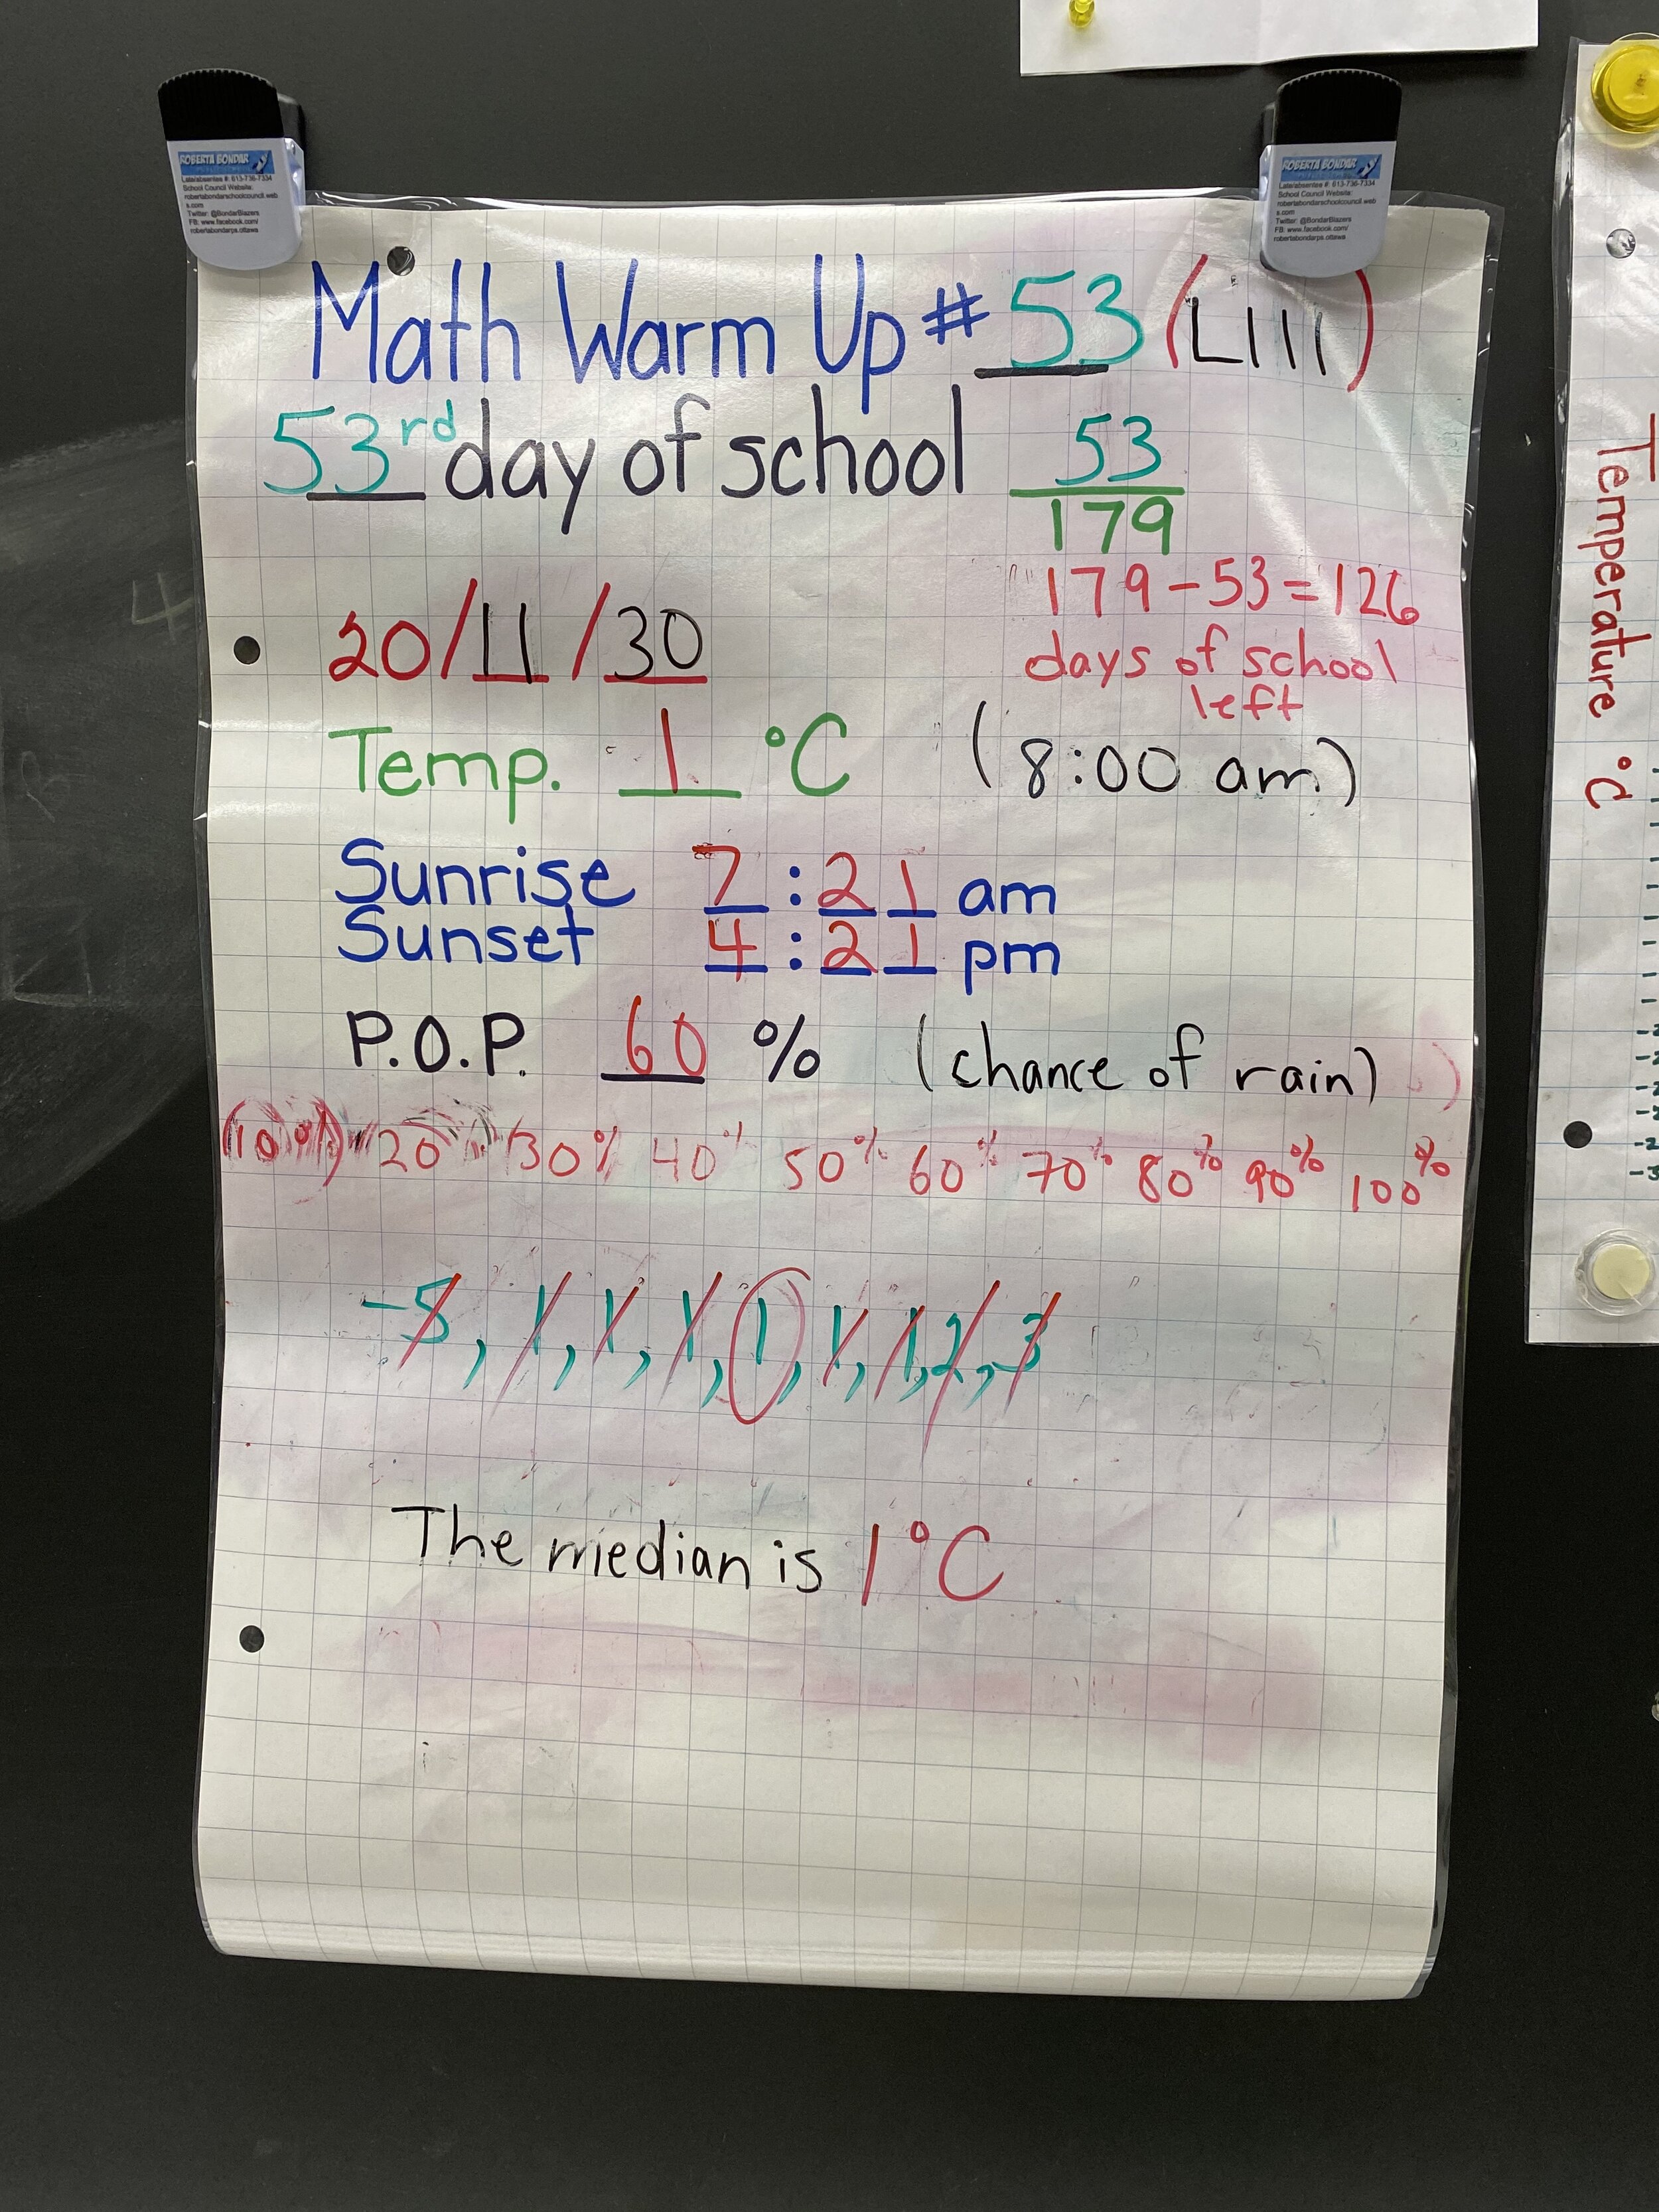
Everyday as part of our math lesson, we run a Math Warm-Up activity, which takes up about 10 minutes of our period. It is a consistent daily activity where we look at temperature, dates, and time to collect number data sets. To keep the activity exciting, each week we add a new feature to the exercise, such as calculating the median of the data set, then the following week introducing the mode, and the following week inviting students to calculate the mean. The photos below are from the first day of my practicum in November, but we are now onto dividing †he fraction of “days left of school” and then converting that into a percentage. We use the Apple weather app as our data source, and have recently begun to think more critically about things like the day’s high, which can only be calculated truthfully in hindsight, at the day’s end. The students track this information in their math grid notebooks, and asked to make predictions based on trends in the previous days. We also graph out daily highs for the month as a whole and assign a set of questions on Google Classroom for students to answer. The students love this activity, especially volunteering their predictions for what the temperature was at 8AM. After practicing this everyday, they’ve fully memorize all the criteria and will call me out on anything I skip. I have to admit, I am a little rusty at my roman numerals! This is just a fun, quick, low-pressure way to introduce new concepts that we will dive further into in our numeracy units, while providing an example of where they will see it in the real world.


